Field Monitoring
The field monitoring underway during this project involves monitoring a burned and unburned area on the same slope (see Figure 1). The lower portion of the slope was burned in June and July of 2018 during the Pawnee Fire and the upper portion has not been burned in recent years. The boundary between the burned and unburned areas is across the crest of the slope. Figure 1 shows that the native vegetation, primarily chaparral, is thicker in the unburned area than the lower burned area.

The instrumentation at each field site includes a meteorological station, which monitors rainfall, wind speed and direction, air temperature, soil moisture content at depths of 4, 8, 12, 16, 20, and 24 inches below the ground surface, and a data logger that records all of the data from instruments every five minutes (see Figure 2). Each instrumentation system is powered by a small solar panel that is visible at the top of the metal pole in Figure 2a. Figure 2b shows how dense the vegetation is around the station even though considerable effort was expended to clear an opening for the equipment. No clearing effort was required to install the station in the burned area (see Figure 2a). The first meteorological station was installed in the burned area on November 16, 2022 and has been collecting data since that date. The second meteorological station was installed in the unburned area on December 14, 2022 and has been collecting data since that date. Data is manually downloaded from each station every five to six months due to a lack of cellular telemetry.

Preliminary Results
Some of the preliminary trends observed in the data obtained from these two instrumented sites include:
- The unburned area has received about 15% more rainfall than the burned area from December 14, 2022 to September 29, 2023—with cumulative precipitation of 670 and 580 millimeters, respectively. In one rain event in February 2023, the burned area received more rain than the unburned area. Otherwise, the unburned area receive has received more or approximately the same amount of rain as the burned area in all of the other rain events, potentially owing to elevation differences (see Figure 1).
- The mean measured air temperature in the burned area is slightly higher than in the unburned area, which is attributed to a reduced presence of vegetation in the burned area.
- Soil moisture gauges installed in the unburned and burned areas show an inverse relationship between mean air temperature and soil moisture content, with higher mean air temperatures correlating with less soil moisture content due to evaporation.
- There is minimal variation in wind speed measured at the burned and unburned sites, with average wind speeds ranging between 1 and 2 meters per second.
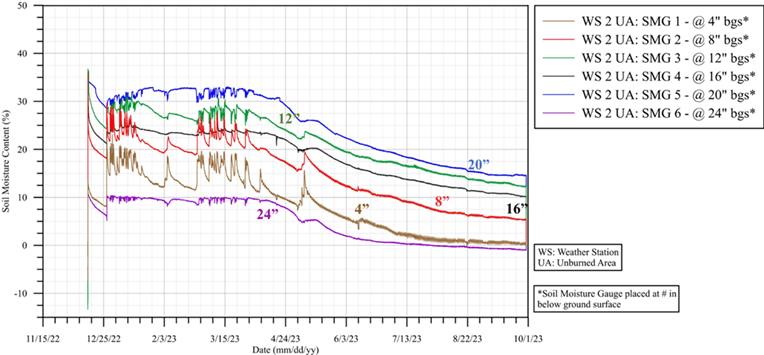
- Soil moisture content responds quickly in the burned area for depths of 20 inches or less as shown in Figure 3.
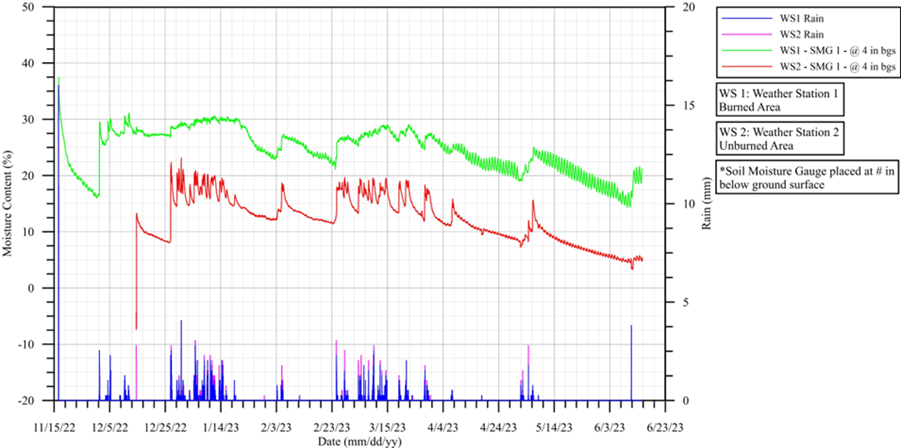
- Soil moisture content is generally higher at the burned area site than the unburned site. Figure 4 presents measured soil moisture content at a depth of 4 inches from the burned (WS-1) and unburned (WS-2) sites with rainfall measured at each station. These data show the soil moisture content ranges from 20 to 30% at the burned site versus only 10 to 20% at the unburned site.
- Soil moisture content responds quicker in the unburned area than the burned area because the rainfall can infiltrate the soil instead of running off in the burned area due to a smaller amount of vegetation (see Figure 4).
Future Work
In this ongoing study, we will continue monitoring temperature (ºC), wind speed (m/s) and direction, rainfall (mm), and soil moisture content (%) in both burned and unburned areas using the installed weather stations. We would like to increase the number of monitoring sites to enhance the spatial coverage and assess the impact of the Ridge Fire that occurred in July 2024 and burned about 3,0000 acres near the two current stations. This would allow monitoring from shortly after a fire to assess the immediate impact of wildfires on slope stability instead of starting about four years after the last fire as occurred for the burned site described above.
